Inverted Hammer Candlestick: Meaning, Formation & Benefits


Candlestick patterns are an important component of chart analysis and trading. They allow you to notice changes occurring in investors’ sentiments and act as reversal points in the movement of asset prices.
The inverted hammer candlestick is one of the most popular candlestick patterns used by investors to get an idea of upcoming directional movements in the prevailing market trends. This candlestick can easily be confused with Harami pattern or hanging man candlestick because of its similar formation. However, its functioning is quite different from these patterns.
Let’s see how this candlestick pattern plays a role in technical analysis of a stock.
What Is an Inverted Hammer Candlestick?
This pattern forms at the end of the current downtrend as pressure from buyers increases the price of underlying securities. The pattern gets its name from its appearance, which looks like an inverted hammer in real life.
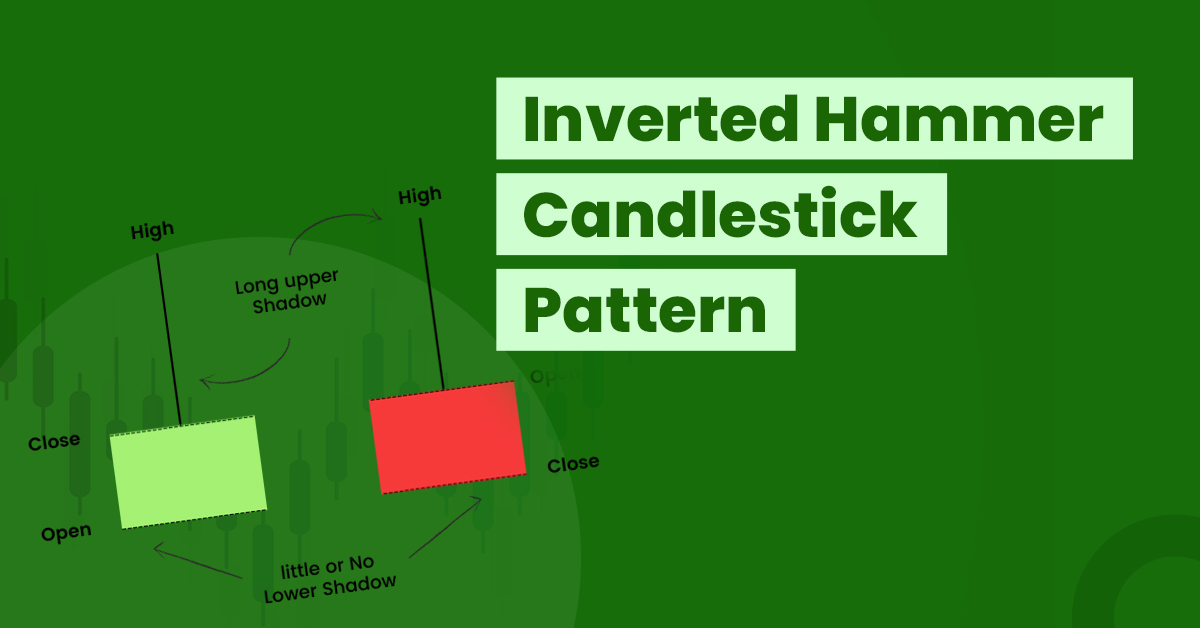
Inverted hammer pattern has a very small lower shadow and a long upper shadow whose size is more than two times the size of the real body. Usually, it is a bullish trend reversal in which the upper wick tries to indicate that bullish traders are fighting hard to increase the security price exponentially.
It can appear in the prevailing uptrend or downtrend. As the name suggests, this candlestick is opposite to the hammer candlestick pattern.
You should remember that it does not serve as an entry signal. This pattern merely indicates a reversal of the current trends.
How Does Inverted Hammer Candlestick Work?
An inverted hammer candlestick gets formed when the opening and closing price of a security are close to each other. However, both these prices will be lower than the day’s high price..
This is not a common pattern as it is indicative of indecision among investors related to underlying assets’ future movements.
This pattern indicates a bullish reversal at the end of a downtrend; this means that the respective stock is having tremendous interest from buyers, which is driving its prices higher. Therefore, sellers or bears can see this as an exit signal and close their positions as soon as possible to avoid losses.
How to Recognise Inverted Hammer Candlestick?
It occurs when market bulls raise the price of concerned assets in a bid to resist the prevailing downward movement. As a result, prices recover and start increasing during the trading session. Bears operating in markets will try to regain control of the asset at the end of the day focusing on price correction. This creates a large upper shadow in the candlestick pattern.
In case bearish sentiments do not pay off and bulls remain in control of the asset, we will be able to see an inverted hammer pattern. After the formation of inverted hammer candlestick, you should wait to see the formation of the next candle before taking any decision.
- In case the next candle is red, it means bears are back in control, and no trade should occur.
- However, if the following candle turns out to be green, it indicates domination of bulls. In this scenario, you can wait till price moves past the high of the inverted hammer pattern for validation that the price of the concerned security will rise further.
It is important to be careful while analysing these patterns so that you do not confuse them for other similar patterns.
Factors to Consider while Dealing with Inverted Hammer Pattern
Here are some factors that you should consider when dealing with inverted hammer candlesticks:
- You can consider entering into a trade on the basis of inverted hammer candles if the price of the asset opens on a higher note the following day. Moreover, the size of the upper shadow shall be twice the length of the real body. Green real body is a positive signal.
- You can always look out for a downtrend prior to the formation of this pattern. The prevailing downtrend indicates pressure coming from bearish groups.
- There are several patterns which are similar to an inverted hammer. It is important to understand the concept of this pattern as it will help you to clearly distinguish between similar patterns and opt for suitable trading positions.
- Apart from the above-mentioned confirmatory signals, there are other indicators as well. These include high trading volume on the day of the formation of this pattern. It primarily happens because buyers or bulls exert tremendous pressure to increase security’s prices.
Moreover, if this pattern forms after a gap of one candlestick, it represents a greater chance of trend reversal.
What Are the Advantages of Inverted Hammer Pattern?
Some advantages of this pattern are as follows:
- Easy to identify
Due to strict identification rules associated with this pattern, it is easy to recognise the same. You need to look out for size proportionality between the shadow and real body. Apart from this, you should also look out for the corresponding location on the chart.
- Entry point
Many traders consider the formation of the inverted hammer as an entry signal in that particular security. If you are entering just when the pattern is getting formed, you have a good chance of earning high returns due to the possibility of upward movement.
- Universally useful
Inverted hammer candlestick pattern does not involve complex calculations or advanced statistical tools to forecast future movements. The pattern offers a general idea about the strength of bullish or bearish tendencies. Therefore, it is universally accepted even among new investors.
What Are the Disadvantages of Inverted Hammer Pattern?
Here are the various limitations of this pattern:
- Not useful in long term
One of the major drawbacks of this pattern is that it may not be useful in the long run. The time period just after the formation of this candlestick may see an increase in the asset’s price. However, there is no guarantee that bulls will be able to sustain their dominance and extend price rise in the long run.
- Narrow view of markets
These may not provide information about the overall functioning of markets or respective sectors. Therefore, it is imperative to look out for other confirmatory signals before taking any trading position.
Final Word
The inverted hammer candlestick is a pattern formed at the close of a downtrend. This pattern merely signals a possibility of bullish trend reversal, i.e., it indicates that bulls can be in control of the respective asset’s price. However, given the volatile nature of stock markets, you must look out for confirmation from other technical indicators before going ahead with trading.
Frequently Asked Questions
What is the role of stop loss in the inverted hammer pattern?
A stop loss order helps traders to safeguard their position against sudden changes in price movements.
In case of the inverted hammer, stop loss should be set at the bottom price of the candle. In case the price goes below the inverted hammer, executing the stop loss order will help to limit losses.
What is a hammer candlestick pattern?
A hammer candlestick pattern indicates bullish sentiments in an asset. It occurs when an asset trades lower than its opening price but recovers significantly to reach opening levels at day’s closing.
Is inverted hammer bearish or bullish?
The inverted hammer is bullish because it occurs when bearish sentiments are easing out of the markets and bulls are gaining an advantage in the particular asset.
What is the colour of inverted hammer candles?
The candles of an inverted hammer could either be red or green in colour. If an asset’s current market price is higher than its opening price, the candle will be green. On the other hand, if the asset’s price goes below its opening price, the candle will be red. However, a green body at the end of a bearish trend is a positive signal.


